


|

|
|

|
|
The CytoSpec program was developed in 2000 by  Peter Lasch, who at the time was working as a postdoctoral fellow with
Max Diem in the
Laboratory for Spectral Diagnosis at Hunter College (CUNY, New York). Since the first version in 2000, the software has
been continuously improved and updated. Today, CytoSpec is known as a specialized software package for vibrational hyperspectral
imaging, supporting a variety of different tasks for data import, export, spectral and spatial pre-processing and uni- or
multivariate imaging. The program is widely used in a scientific environment and has been the workhorse in more than
400 scientific studies. The CytoSpec software has been continuously
developed over the past years and now supports most current hardware platforms, including 64-bit Windows and LINUX
environments, see 64-bit version of CytoSpec and
CytoSpec for LINUX for details.
Peter Lasch, who at the time was working as a postdoctoral fellow with
Max Diem in the
Laboratory for Spectral Diagnosis at Hunter College (CUNY, New York). Since the first version in 2000, the software has
been continuously improved and updated. Today, CytoSpec is known as a specialized software package for vibrational hyperspectral
imaging, supporting a variety of different tasks for data import, export, spectral and spatial pre-processing and uni- or
multivariate imaging. The program is widely used in a scientific environment and has been the workhorse in more than
400 scientific studies. The CytoSpec software has been continuously
developed over the past years and now supports most current hardware platforms, including 64-bit Windows and LINUX
environments, see 64-bit version of CytoSpec and
CytoSpec for LINUX for details.
Studies in which CytoSpec has been used, commented or reviewed
How to obtain the program:
The full program (commercial version) can be ordered from CytoSpec. Please email your request to CytoSpec (email:
order@cytospec.com). A free demo version with limited functionality is also
available. Please send an email to
service@cytospec.com
(link) to obtain a licence key for this demo version.
To obtain the most recent version of the CytoSpec online help go to the
CytoSpec web pages.
Introduction to the program/short description:
The CytoSpec software package is a program specifically designed for the analysis of vibrational hyperspectral (IR and Raman)
imaging data sets. The major innovation of the CytoSpec software over competing software packages is its structure, which manipulates
hyperspectral data cubes rather than individual spectra. This means that all operations performed on the data affect every spectrum,
with the number of spectra in the dataset limited only by available memory.
The CytoSpec software is a stand-alone, comprehensive package that runs under Windows (7/8/10) and LINUX operating systems.
Hyperspectral data sets, in the format defined by the manufacturer of the Raman or infrared microspectrometer used, are imported,
converted and stored in a CytoSpec-specific data matrix format.
The software allows standard spectral manipulations such as expansion, smoothing, scaling, normalization, etc. that are common in
single spectrum analysis software. Due to the fact that data sets often contain hundreds or thousands of spectra, a number of
statistical approaches to the data are built into the software. These can be divided into univariate and multivariate statistical
methods. The univariate analysis methods included in the software consist of different mapping displays of hyperspectral data.
These allow the user to select band intensities, integrated intensities, frequencies, intensity ratios, etc. to construct pseudo-color
representations of the spectral data, which can be viewed as slices through the hyperspectral data cube.
The multivariate data analysis methods create spectral correlations and maps by using not just one intensity or frequency point of
a spectrum, but the entire spectral information. These methods include Principal Component Analysis (PCA), unsupervised clustering
methods, and endmember selection methods. The software is configured to output spectral data in the formats used by other software
packages, such as Synthon Analytics' NeuroDeveloper™, a neural network simulator.

|
SYSTEM REQUIREMENTS:
Software:
-
Windows 10 or 11. Outdated Windows 98, ME, 2k, XP, Vista, 7, or 8 versions are not recommended!
-
LINUX (tested under Debian Buster, Bullseye and Bookworm)
-
CytoSpec 64-bit requires a Windows (10/11) 64-bit, or LINUX 64-bit version of the operating system. In addition, CytoSpec Windows
64-bit versions later than 2.00.04 require installation of the Matlab Compiler Runtime (MCR) 64-bit, either R2014a, R2020a, or
R2023b, see CytoSpec 64-bit for details.
-
Outdated CytoSpec 32-bit can be installed on either Windows 32-bit or Windows 64-bit operating system versions. Note that CytoSpec 32-bit
cannot use the memory advantage of 64-bit operating systems.
-
Software to display these help files, that is a web browser such as Firefox, Microsoft Edge, Opera, Google Chrome, etc.
|
Hardware:
-
Approx. 150 MB of free disk space for the program plus demo and example files (max)
-
At least 4096 MB (4 GB) of RAM, more RAM is highly recommended
-
Modern 64-bit CPUs from Intel or AMD
-
At least an 8 bpp 960x720 graphic display. Supported display modes:
960 x 720 (minimum)
1024 x 768
1152 x 864
1280 x 1024
1600 x 1200
and a large variety of wide screen resolutions
-
To use CytoSpec 64-bit a full 64-bit hard- and software environment will be required. Please refer to the
CytoSpec 64-bit documentation for details.
|
INSTALLATION:
Commercial versions: Once you have received the CytoSpec CD, USB stick or downloaded the installation archive from the CytoSpec web server,
you are ready to install the program. During the installation process, CytoSpec files are automatically extracted from the cabinet and all necessary
steps to start CytoSpec are performed.
Demo versions: Download the CytoSpec 64-bit installation package from the
CytoSpec website.
CytoSpec Windows p-code versions: Please see CytoSpec 64-bit for details. Note that with
the availability of 64-bit stand alone CytoSpec v. 2.00.05, the CytoSpec p-code version will be discontinued.
CytoSpec LINUX p-code versions: Please see CytoSpec for LINUX for details.
Installation procedure of CytoSpec's 64-bit, stand alone Windows version 2.00.05 and later
-
Login with your Windows user account and and unzip the CytoSpec 64-bit installation package. The zip archive 'CytoSpec.64bit.2.00.xx.setup.R20xx.zip'
contains aside from the CytoSpec setup file also the license key 'cytospec.lic' (commercial users only). This key should be stored in the same
folder as the setup file.
-
Download the Windows version of the Matlab Compiler Runtime (MCR) Environment R2014a, or 2020a, both 64-bit from the website of
The Mathworks.
Download the following MCR Windows 64-bit versions depending on the CytoSpec build version used:
→ CytoSpec version 2.10.01 64-bit (build 374) requires → MCR R2023b (23.2) ← (64-bit, Windows)
→ CytoSpec version 2.00.07 64-bit (build 372c) requires → MCR R2020a (9.8) ← (64-bit, Windows)
→ CytoSpec version 2.00.07 64-bit (build 372b) requires → MCR R2014a (8.3) ← (64-bit, Windows)
→ CytoSpec versions 2.00.07 64-bit (build 370) and earlier require → MCR R2014a (8.3) ← (64-bit, Windows)
Save the Matlab Compiler Runtime installer file on the computer on which you plan to run CytoSpec. Then double click the installer
and follow the instructions in the installation wizard. Please refer also to the description of the section
Ordering the Program, License & Disclaimer for further details.
-
Start'CytoSpec.64bit.2.00.xx.setup.exe' and follow the instructions of the installation routine
-
Trial version users only: the license file 'cytospec.lic' is not included in the installation package. To register for a free, time-limited
demo license please send an email with your name and the name of the institution you are working for to the address service@cytospec.com
The license key will be provided as an email attachment. Copy the key file sent per email into the DiaryDir folder of the CytoSpec installation
(this is usually C:\Users\Public\Documents\Matlab, administrator rights are sometimes required).
-
When setup is complete there will be a new program group and a CytoSpec shortcut on the desktop.
-
Start the program by double clicking on the CytoSpec icon.
-
Trial version users only: Note that the temporary license for CytoSpec demo versions will expire after 90 days (regular demo), or 75 days (demo
with full functionality).
Installation procedure of 32-bit, stand alone CytoSpec versions (support discontinued)
-
Login with your Windows user account and and unzip the CytoSpec 32-bit installation package. The zip archive 'CytoSpec.32bit.2.00.xx.setup.zip'
contains aside from the CytoSpec setup file also the license key 'cytospec.lic' (commercial users only). This key should be stored in the same
folder as the setup file.
-
Start 'CytoSpec.32bit.2.00.xx.setup.exe' and follow the instructions of the installation routine
-
Trial version users only: the license file 'cytospec.lic' is not included in the installation package. To register for a free, time-limited
demo license please send an email with your name and the name of the institution you are working for to the address service@cytospec.com
The license key will be provided as an email attachment. Copy the key file sent per email into the DiaryDir folder of the CytoSpec installation
(this is usually C:\Users\Public\Documents\Matlab, administrator rights are sometimes required).
-
When setup is complete there will be a new program group and a CytoSpec shortcut on the desktop.
-
Start the program by double clicking on the CytoSpec icon.
-
Trial version users only: Note that the temporary license for CytoSpec demo versions will expire after 90 days (regular demo), or 75 days (demo
with full functionality).
|
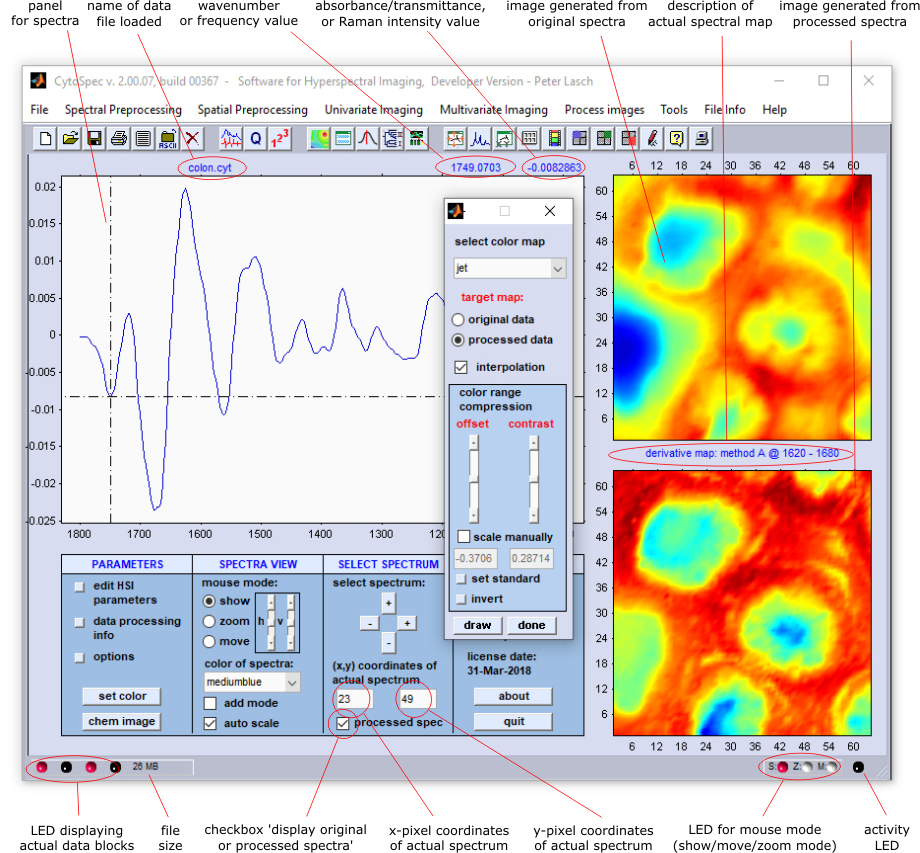
CytoSpec's graphical user interface (GUI, also known as the main window) has three panels displaying spectra and images (see screenshot of
the CytoSpec GUI below). The two panels on the right are used to display the pseudocolor images obtained from the original spectral data
(upper right panel) or from processed spectra such as preprocessed data, derivatives, and (de)convolution data (see lower right panel).
The latter panel is also used to display images obtained by various multivariate analysis methods: (i) clustering, (ii) endmember selection,
(iii) neural network-based segmentation techniques, or by (iv) principal component analysis.
The color scheme utilized to display the pectral maps can be changed (see button 'set color' of the main window, cf. also the
set colors option from the Tools menu bar). In addition, the CytoSpec
program offers a number of useful tools for adjusting parameters such as image contrast and color scaling.
Furthermore, the CytoSpec program provides easy access to the individual pixel spectra. By clicking (left mouse button) on a predefined image
generated by univariate imaging methods the
- spectrum with the pixel coordinates of the mouse pointer is displayed in the spectra display panel,
- the pixel coordinates of the active spectrum appear in editable boxes, and
- some information of how the spectral image has been produced is displayed in the area between both image panels.
Many options for displaying spectra can be modified (button 'display options', option 'display options' of the Tools
menu bar). For more details please refer to the chapter
Working with Spectra - Basic Concepts.
The following section describes the interactive display mode of the CytoSpec v.2.0 program. The following interactive display features are
available in this version:
Mouse modes:
- show: displays the pointer's x- and y-position in the 'spectra' information field
- zoom: can be used to interactively zomm in/out a part of the spectrum
- move or 'roll' mode': rolls or moves the spectrum in any direction
Individual pixel spectra from a hyperspectral image can be displayed in the left panel of the GUI. Spectra display options can be selected
from the main CytoSpec window (the 'display options' window of earlier CytoSpec versions has been removed). The following options are
available:
- interactive disply of wavenumber and absorbance values (radio button 'show')
- interactive zoom mode (radio button 'zoom')
- interactive move mode (radio button 'move')
- set color of curves (list box 'color of spectra')
- zoom window horizontal/vertical (sliders)
- show multiple spectra (checkbox 'add mode')
- x-y auto-scaling for active spectrum (checkbox 'auto scale')
In the 'show' mouse mode, the x- and y-position of the mouse pointer are displayed in the 'spectra' information field of
the GUI.
Using the 'zoom' mode: To zoom in (zoom out) spectra in the display window first activate the corresponding radio button.
Then, if you want to zoom in parts of a spectrum, you have to set the first position for the spectrum window with a left mouse click.
Hold down the mouse button and drag a frame by moving the mouse to the second point. When you release the mouse button, the contents of
the frame will expand to fill the entire display window. To reduce the size of the spectrum, you can use the right mouse button in the
same way.
A left mouse click, i.e. when no frame is drawn, expands the spectrum in the display window by 200%. A right mouse click
reduces the size to 50%.
The 'move' mode is used to roll the spectrum in any direction. The display boundaries are shifted so that all spectra displayed
are shifted by the same amount. Again, the corresponding radio button muste be activated before starting. Spectra can then be moved by
clicking (left mouse button) into the display window and moving the mouse pointer to the desired end point (the mouse pointer changes to
a closed hand symbol). Release the left mouse button to finally roll the spectra in the desired direction.
How do I select spectra for display? There are three methods are available to select spectra for display from a hyperspectral map:
Method A: Create an univariate image of the hyperspectral map. Then click into one of the images ('show mode' should
be activated). The [x,y] pixel coordinates of the spectrum to be displayed are obtained and the corresponding spectrum is plotted.
Furthermore, the [x,y] pixel coordinates of the active spectrum are displayed in the edit fields of the GUI (see x/y coordinates
of the active spectrum. Depending on the type of the image generated (image produced from original, or processed data) the check box
'show work spectrum' is activated (or deactivated). CytoSpec displays an error message in cases where activated images have been
re-assembled by multivariate imaging methods (PCA ,
HCA , etc.).
Method B: Alternatively, spectra can be selected by manually editing the edit fields '[x,y] coordinates of actual spectrum'
and/or by activating the check box 'processed spec'. If the corresponding image, or data block, does not exist (e.g. there is
no image of preprocessed spectra), an error message will be displayed.
Method C: The selection of spectra to be displayed can also be done by pressing the [+] (plus) or [-] (minus) buttons located
in the 'select spectrum' area of the CytoSpec GUI. This will stepwise increase/decrease the y, or y-pixel coordinate of the
spectrum to be displayed.
|
CytoSpec's main window displays a series of icons. The following table provides a brief overview of the icons and their associated CytoSpec
functions.
In addition, CytoSpec provides many keyboard shortcuts to speed up image recombination and data export to other applications. You will find
that you can save a lot of time by eliminating the need to move the mouse and select options from the menu bars.
Keyboard Shortcuts
Icons
 | clear all |
 | load spectral map |
 | save all |
 | print |
 | customize |
 | export ASCII spectra |
 | exit |
 | calculate derivatives |
 | quality tests |
 | batch mode |
 | chemical imaging |
 | chemical movie |
 | frequency imaging |
 | HCA imaging |
 | Synthon imaging |
 | autoscale spectra |
 | display spectra |
 | set display limits manually |
 | grid on/off |
 | set color |
 | capture spectral plot |
 | capture image (org. data) |
 | capture image (proc. data) |
 | edit |
 | help |
 | about |
| |
|
Internal data organization: In CytoSpec, a data block represents a complete hyperspectral (3D) data cube in which spectral
intensities or absorbance/transmittance data are arranged as functions of two spatial [x,y] coordinates and one spectral coordinate.
CytoSpec is designed to manipulate up to four different variations of the actual hyperspectral data cube. These variations are called
data blocks, and all different blocks can be saved and loaded in a single file.
- Original spectra: the first block is reserved exclusively for the original spectra,
usually absorbance or transmittance spectra, or Raman intensities in case of Raman imaging data. Original data are usually
not modified. Exceptions are the functions 'cut' and 'interpolate' of the preprocessing menu and the
functions 'swap data blocks', 'rotate', and 'flip' of the 'tools' menu bar.
- Preprocessed spectra: this data block contains the results of data manipulations on
original spectra (e.g. preprocessed data).
- Derivative spectra: the third data block is reserved for derivative spectra.
- (De)convolution spectra: block number four contains the results of spatial preprocessing:
spatial filtering, 3D Fourier self-deconvolution (FSD), edge-preserving denoising, etc..
Spectral and spatial preprocessing, multivariate image analysis, and image reassembly can be performed by selecting one of the existing
data blocks (also called 'source blocks'). The results of the data manipulation are stored in 'target data blocks'. Note
that some operations may overwrite existing target data blocks without warning! Target data blocks may vary for different functions
(for details, see the synopses below).
I. Preprocessing (except functions 'cut', 'crop', 'interpolate', 'binning',
'derivatives',
'baseline correction', and 'ABS ↔ TR'):
| source block |
|
target block |
| original spectra |
»» |
preprocessed spectra |
| preprocessed spectra |
»» |
preprocessed spectra |
| derivative spectra |
»» |
derivative spectra |
| (de)convolution spectra |
»» |
(de)convolution spectra |
II. 'Derivative calculation':
| source block |
|
target block |
| original spectra |
»» |
derivative spectra |
| preprocessed spectra |
»» |
derivative spectra |
| derivative spectra |
»» |
derivative spectra |
| (de)convolution spectra |
»» |
derivative spectra |
III. 'Cut', 'crop', 'interpolate', 'binning', 'rotate' & 'flip':
| source block |
|
target block |
| original spectra |
|
The functions cut', 'crop', 'interpolate', 'binning', 'rotate
' & 'flip' modify the number of points (pixels), or the point (pixel) spacing in the spectral and/or spatial dimensions,
respectively. All available data blocks are modified . |
| preprocessed spectra |
|
| derivative spectra |
|
| (de)convolution spectra |
|
IV. 'Baseline correction', 'PCA based noise reduction':
| source block |
|
target block |
| original spectra |
»» |
preprocessed spectra |
| preprocessed spectra |
»» |
preprocessed spectra |
| derivative spectra |
»» |
not possible |
| (de)convolution spectra |
»» |
not possible |
V. 'Swap data blocks':
| source block |
|
target block |
| original spectra |
|
not possible |
| preprocessed spectra |
»» |
original spectra |
| derivative spectra |
|
not possible |
| (de)convolution spectra |
»» |
preprocessed spectra |
VI. 'ABS ↔ TR':
| source block |
|
target block |
| original spectra |
|
Original spectra will be overwritten by converted data. All other data blocks
will be deleted! |
| preprocessed spectra |
|
| derivative spectra |
|
| (de)convolution spectra |
|
VII. 'Node attenuation' & 'Fourier self-deconvolution':
| source block |
|
target block |
| original spectra |
|
Results of node attenuation and Fourier self-deconvolution are stored in data block 4:
(de)convolution data
|
| preprocessed spectra |
|
| derivative spectra |
|
not possible |
| (de)convolution spectra |
|
not possible |
VIII. 'Subtraction':
| source block |
|
target block |
| original spectra |
»» |
preprocessed spectra |
| preprocessed spectra |
»» |
preprocessed spectra |
| derivative spectra |
»» |
derivative spectra |
| (de)convolution spectra |
»» |
not possible |
IX. 'Spatial Filtering', 'edge-preserving denoising' & '3D-Fourier self-deconvolution'':
| source block |
|
target block |
| original spectra |
»» |
(de)convolution spectra |
| preprocessed spectra |
»» |
(de)convolution spectra |
| derivative spectra |
»» |
derivative spectra |
| (de)convolution spectra |
»» |
(de)convolution spectra |
X. 'Replace NaN's':
| source block |
|
target block |
| original spectra |
»» |
not possible |
| preprocessed spectra |
»» |
preprocessed spectra |
| derivative spectra |
»» |
derivative spectra |
| (de)convolution spectra |
»» |
(de)convolution spectra |
The presence/absence of data blocks is visualized by four LEDs located in the lower left corner of the main window. A red LED indicates
the presence of a data block, a black LED indicates its absence.
Memory management modes: CytoSpec offers two distinct memory management modes. This functionality was introduced to allow
highly memory consuming operations even with limited RAM resources. With version 2.00.01 and the availability of the
64-bit version of CytoSpec the 'compress' memory mode is obsolete
and has been removed.
- 'Speed' The fastest mode, but very memory intensive. Recommended for HCA
with hyperspectral data sets containing up to 128 x 128 pixel spectra (32-bit version, 4 GB RAM required). In this mode, all
spectral data is held in memory as float64 values with 8-byte precision. This option is also recommended for
HCA of larger hyperspectral data sets when using the
64-bit version of CytoSpec (Matlab toolbox).
- 'Intermediate' - uses less memory consuming and relatively fast. Try this option when data sets are large and/or the amount
of installed RAM is reduced. Spectral data is stored on disk with 4 byte precision as float32 values. Only the required block of
data is loaded and kept in memory during calculations. When performing
HCA , the distance matrix is held in RAM.
- 'Compress' - removed with version 2.00.01 (see 64-bit version of
CytoSpec for details).
|
With CytoSpec version 2.00.01 (build version 338) the 'display options' window has been removed. The functionality is now integrated
into the main window of CytoSpec.
How do I select spectra for display? There are three methods are available to select spectra for display from a hyperspectral map:
Method A: Create an univariate image of the hyperspectral map. Then click into one of the images ('show mode' should
be activated). The [x,y] pixel coordinates of the spectrum to be displayed are obtained and the corresponding spectrum is plotted.
Furthermore, the [x,y] pixel coordinates of the active spectrum are displayed in the edit fields of the GUI (see x/y coordinates
of the active spectrum. Depending on the type of the image generated (image produced from original, or processed data) the check box
'show work spectrum' is activated (or deactivated). CytoSpec displays an error message in cases where activated images have been
re-assembled by multivariate imaging methods (PCA ,
HCA , etc.).
Method B: Alternatively, spectra can be selected by manually editing the edit fields '[x,y] coordinates of actual spectrum'
and/or by activating the check box 'processed spec'. If the corresponding image, or data block, does not exist (e.g. there is
no image of preprocessed spectra), an error message will be displayed.
Method C: The selection of spectra to be displayed can also be done by pressing the [+] (plus) or [-] (minus) buttons located
in the 'select spectrum' area of the CytoSpec GUI. This will stepwise increase/decrease the y, or y-pixel coordinate of the
spectrum to be displayed.
|
The basic idea of vibrational hyperspectral imaging is to derive for each individual [x,y] pixel spectrum of a given
HSI a single value that can be color scaled and plotted as a function of its spatial [x,y]
coordinate. In the simplest case of so-called chemical imaging, the resulting pseudo-color image represents the spatial
variation of the concentration of a given functional group or chemical constituent. Although a variety of parameters other than
simple intensity values have been proposed, chemical imaging is by far the most commonly used method, probably due to its simplicity
and ease of interpretation. In chemical imaging - also known as functional group mapping - the absorbance, transmittance, Raman intensity,
band half-width, or frequency of a given vibrational band is color-coded and plotted against spectral pixel coordinates. Such univariate
imaging methods allow visualization of spatial distribution patterns of functional groups or specific chemical substances and are widely
used not only in biomedical applications of hyperspectral imaging, but also in remote sensing and related research areas.
The CytoSpec software allows creating chemical images to be generated using a number of different univariate
HSI methods. For example, imaging based on absorbance or transmittance values, integrated absorbance values, Raman intensities, and
intensity ratios thereof, can be performed using the function
Chemical imaging.
Furthermore, CytoSpec offers the possibility to re-assemble so-called
Frequency images. In frequency imaging, the maximum position of specific bands is automatically determined. Frequency images are then
re-assembled by color coding the band positions, i.e. frequency, wavelength, or wavenumber values and plotting them against the [x,y] pixel
coordinates. A related strategy allows creation of uni-variate pseudo color displays from half-widths of selected IR, or Raman bands, see
the FWHM Imaging function for details.
A second group of hyperspectral imaging techniques relies on multivariate methods of spectral data analysis. Cluster imaging, for example, first
performs a cluster analysis (hierarchical clustering, k-means, fuzzy C-means) by using the complete set of pixel spectra as input. In this way,
cluster membership functions are determined for each individual pixel spectrum of the HSI . Recombination
of these functions with the [x,y] spatial information is then used to produce false color displays, either as multicolor segmentation maps, or
as single component cluster membership displays. The current version of CytoSpec (v.2.00.07) offers ten different methods of multivariate
hyperspectral spectral imaging:
Principal Component Analysis (PCA) imaging
Imaging based on hierarchical cluster analysis: HCA imaging
k-means cluster imaging
Fuzzy C-means cluster imaging
Imaging based on ANN (Artificial Neural Network) analysis (SNNS imaging)
ANN Imaging based on ANN models developed by the help of Synthon's
NeuroDeveloper software
Vertex Component Analysis (VCA) imaging
n-findr imaging
Imaging with distances values
MCR-ALS imaging
A detailed description of these multivariate hyperspectral imaging methods can be found in the respective chapters of the CytoSpec online documentation.
|
When the CytoSpec program is started the Main Window and a report window
(see screenshot below) appear. While the graphical user interface (GUI) of CytoSpec allows interacting with the program, the report window
displays input parameters and reports non-standard errors. These messages are stored in a log-file ('history.log'), which can be found
in the following locations:
CytoSpec standalone versions (64-bit, 32-bit, v.2.00.05 and later), Windows operating systems (7/8/10): DiaryDir of CytoSpec,
usually C:\Users\Public\Documents\Matlab\history.log
CytoSpec pcode toolbox under Matlab (64-bit, pre-2.00.05 versions), Windows operating systems (7/8/10): Matlab user directory,
usually C:\users\Username\Documents\Matlab\history.log with 'Username' being the Windows user name
CytoSpec standalone version (32-bit, pre-2.00.05 versions), Windows operating systems (2k/XP/Vista/7): RootDir of the CytoSpec program,
usually C:\program files\CytoSpec\CytoSpec\history.log or C:\program files (x86)\CytoSpec\CytoSpec\history.log
Please send the file 'history.log' to the following email address:
service@cytospec.com when reporting problems
and software failures (bug reports)
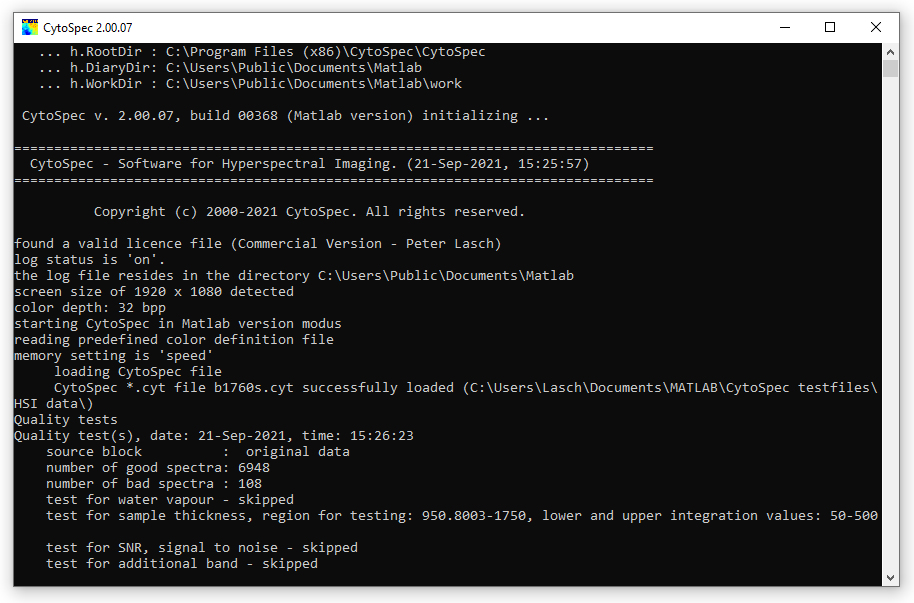
Screenshot of the CytoSpec report, or command line window
|
How to obtain CytoSpec?
A. Ordering the full (commercial) version
The commercial version (unlimited license, complete functionality) can be ordered from CytoSpec. Please email your request to CytoSpec (email:
order@cytospec.com).
B. Downloading an evaluation (demo) version
You can also download a free demo version (time-limited trial version with limited functionality) of CytoSpec. In order to run CytoSpec
an additional license key file ('cytospec.lic') must be obtained and copied into CytoSpec's DiaryDir directory (see
Installation, System Requirements for details). This individual license key is NOT
included in CytoSpec's online zip archives and will only be sent upon request. Please send your request together with your name and an institutional
address to the following email address:
service@cytospec.com
(link)
Most actual Windows version: CytoSpec stand alone 2.10.01 64-bit (build 374), Windows OS - please report software bugs
CytoSpec stand alone 64-bit, requires license key 'cytospec.lic' and
MCR2023b
version 2.10.01, build 374, Mar 2025
size: 64164307 bytes (packed)
CRC checksum for data: 64A161DC |
 |
CytoSpec stand alone version 2.00.07 64-bit (builds 372b and 372c), Windows OS
CytoSpec stand alone 64-bit, requires license key 'cytospec.lic' and
MCR2020a
version 2.00.07, build 372c, Oct 2023
size: 11481044 bytes (packed)
CRC checksum for data: 72946EB6 |
|
CytoSpec stand alone 64-bit, requires license key 'cytospec.lic' and
MCR2014a
version 2.00.07, build 372b, Aug 2023
size: 10782756 bytes (packed)
CRC checksum for data: 71A41966 |
|
CytoSpec stand alone version 2.00.07 64-bit (build 370), Windows OS
CytoSpec stand alone 64-bit, requires license key 'cytospec.lic' and
MCR2014a
version 2.00.07, build 370, Mar 2022
size: 10693867 bytes (packed)
CRC checksum for data: 41629DEF |
|
Most actual LINUX version: CytoSpec pcode 2.00.07 64-bit (build 369), LINUX OS - please report software bugs
CytoSpec 64-bit p-code toolbox, LINUX OS, version 2.00.07, build 369, Oct 2021, tested under MATLAB R2018a
and MATLAB R2020a, requires license key 'cytospec.lic'
size: 853468 bytes (packed)
CRC checksum
for data: D854ABEC |
|
CytoSpec stand alone version 2.00.06 64-bit (build 360), Windows OS
CytoSpec stand alone 64-bit, requires license key 'cytospec.lic' and
MCR2014a
version 2.00.06, build 360, Aug 2019
size: 18000035 bytes (packed)
CRC checksum for data: 69AA2BF5 |
|
CytoSpec stand alone versions 2.00.05 (32- and 64-bit, build 353), Windows OS
CytoSpec stand alone 64-bit, requires license key 'genkey.gen' and
MCR2014a
version 2.00.05, build 353, Feb 2018
size: 10605365 bytes (packed)
CRC checksum for data: 2FE9B595 |
|
Download CytoSpec's stand alone 32-bit package, Windows OS, requires license key 'genkey.gen'
version 2.00.05,
build 353, Feb 2018
size: 15594207 bytes (packed)
CRC checksum for data: 6CF5EDAB |
|
Test data (binary example files, ASCII data)
Binary and ASCII test data
size: 87252561 byte (packed)
CRC checksum for data: C4DCF064 |
|
CytoSpec 64-bit Matlab pcode, v. 2.00.04, Windows OS, a Matlab license for R2014a or newer will be required
CytoSpec 64-bit p-code toolbox, requires license key 'genkey.gen', tested under MATLAB R2014a
version 2.00.04, build 349, July 2017
size: 824098 bytes (packed)
CRC checksum for data: C0F9FF9F |
|
Earlier 32-bit demo versions of CytoSpec, Windows OS:
CytoSpec standalone demo, requires license key 'genkey.gen'
version 2.00.04, 32-bit, build 349, July 2017
size: 15643993 byte (packed)
CRC checksum for data: 2F3FBCB6 |
|
CytoSpec standalone demo, Windows OS, requires license key 'genkey.gen'
version 2.00.03, 32-bit, build 348, April 2016
size: 15384132 byte (packed)
CRC checksum for data: 40C33B2B |
|
Please note that you accept with downloading the following license conditions:
You are using the program at your own risk! CytoSpec does not take any responsibility for damages, problems etc. resulting from use of this
program. CytoSpec also does not give any warranty for bug-free operation, fitness for a particular purpose or the appropriate behavior of
the program.
The software is provided 'AS IS'. For your personal use you can make copies and run as many instances as required, but it
is not allowed to further distribute this software.
View the complete license agreement
All trademarks mentioned are property of their owners.
|

 Load
Load