CytoSpec - an APPLICATION FOR HYPERSPECTRAL IMAGING |
|||||||||


|
|||||||||
|
|
|
||||||||
|
|
|||||||||
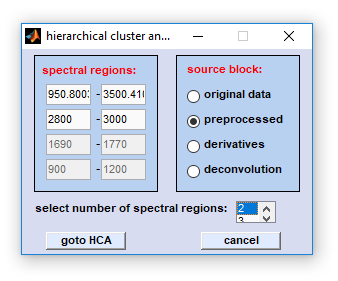
Data Selection for Multivariate Imaging |
|||||||||
|
|||||||||

 Load
Load
|
Procedure of data selection: select first the type of source data block. Then define the number of spectral regions and indicate the frequency, or wavenumber limits of all spectral regions. Note that regions must not overlap, an error message will be given otherwise. Press 'goto XXX' (XXX: HCA/KMC/etc.) when finished. Important: Spectra with a negative Please note: The function |
Reformatting data sets for multivariate imaging: Data selection for multivariate imaging involves the following steps:
- NaN spectra (negative quality test, unselected regions of interest, see above) are removed.
- Spectral information from the indicated frequency, or wavenumber region(s) is extracted from the selected source data block and
concatenated. Of note, this step does not apply to the function
 Imaging with
distance values!
Imaging with
distance values! - The hyperspectral 3D [x,y,z] data is unfolded into a two-dimensional [xy,z] data format. Original [x,y] spatial variables are
converted into a mixed spatial variable [xy] (except for the function
HCA of chemical images).
- The reformatted 2D data set is transferred to the respective multivariate imaging function.

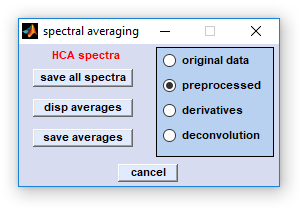
Multivariate Imaging - Dialog Box 'Spectra'
The dialog box 'spectral averaging' is available from a number of multivariate imaging functions, usually via the button
'spectra'. The functions allows extracting, storing and displaying cluster mean spectra (i.e. average spectra) in case
of cluster imaging functions or of ROI mean spectra in case of application of the function
define regions of interest (ROI).
Cluster imaging methods with functionality to produce cluster mean spectra:
Hierarchical cluster analysis (HCA)
k-means clustering (KMC)
fuzzy C-means clustering (FCM)
Cluster mean spectra are obtained by simply averaging all spectra assigned to a given cluster (HCA, or KMC), whereby hard
(crisp) cluster membership values provided by HCA or KMC are analyzed. In case of fuzzy C-means (FCM) cluster imaging, spectra
to be averaged are defined on the basis of the maximum values of the spectra's cluster membership functions: a spectrum is
assigned to an individual cluster (i) if the respective membership value represents the maximum value and (ii) if this value
is larger than 0.5+(1/ncluster²), where 'ncluster' denotes the number of clusters.
Define regions of interest:
define regions of interest (ROI)
The dialog box 'spectral averaging' can be used to obtain, store and display mean spectra from pre-defined regions of
interest.
|
save all spectra: allows storing all [x,y] pixel spectra from the selected source data block with assignment to a given cluster. The file format, either ASCII (double column, tab separated, *.dat) or binary (*.spc) can be defined by the function Core files names can be defined in the standard file selection dialog box provided by the operating system. disp averages: permits plotting mean spectra by using the selected source data block. CytoSpec returns an error message in cases where the data block is empty. Spectra are plotted by the same color like in the cluster segmentation image. Note that color coding and cluster indices are provided also by the |
save averages: calculates and stores cluster mean, or ROI mean spectra from the selected source data block. The file format, either ASCII (double column, tab separated, *.dat) or binary (*.spc) can be defined by the function
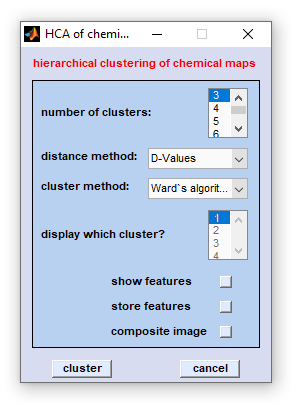
HCA of Chemical Images
HCA of image domain data: This function has been introduced with CytoSpec version 2.00.03 (Apr 2016). Unlike the function
HCA imaging, which creates pseudo-color segmentation images
based on spectral domain information, this functions allows performing hierarchical cluster analysis (HCA) of chemical images,
i.e. of image (spatial) domain information. Clustering images instead of spectral domain information is based on the idea that
image slices of a HSI exhibiting similar spatial distributions patterns are somehow related and possibly belong to the same
chemical species. Clustering images is thus thought to allow identification of spectral features originating from the same
chemical constituent, even in case of characterizing complex mixtures.
Clustering images in the CytoSpec implementation is not only useful for analysis of spectral features. The functions permits
furthermore construction of cluster average images and of composite images thereof.
Data selection: After selection of the function 'HCA of chemical images' a standard dialog box entitled 'HCA
of chemical maps' comes up. This dialog box allows selecting up to four non-overlapping spectral regions from the data block
of choice, see help chapter data selection for multivariate imaging
for further details.
Once data selection has been completed, the following dialog box will appear:
|
number of clusters: please choose the number of clusters used for image domain HCA, minimum is 2, maximum: 49 |
Reference to the literature:
Create Composite Image from Image Context Menus
CytoSpec's function 'Create composite image': This function has been introduced with CytoSpec version 2.00.05 and is available from the
context menus of false color images produced by uni- and multivariate image re-assembling methods. Composite images can be regarded simple
overlays of individual pseudo-color images. Such overlays can be produced from any combination of chemical, or multivariate images and allow
visualizing the spatial distribution of different functional groups in one image, or superimposing chemical images and spatial segmentation images.
Compositing (Wikipedia)
CytoSpec versions 2.00.07 and later offer composite images to be produced also by multivariate imaging functions, such as
Note that this section describes the procedure of manually constructing composite images from univariate and or multivariate displays via context
menus of images. To learn more about constructing composite images by the multivariate imaging functions listed above please refer to the help
sections of these multivariate imaging functions. See also composite image
(multivariate)
How to create composite images from pseudo-color uni- or multivariate displays?
- Create any type of pseudo-color representation from the spectral hypercube. Images can be produced by uni-variate methods
such as chemical imaging
(intensity/absorbance-based, from band positions
or from band-widths). Multivariate images, or segmentation
images are further suitable components of composite images.
- Select and adapt the colormap. Use the function set colors
for choosing colormaps and adapting offset and contrast of the components, or channel images. When creating composite images,
it is strongly recommended utilizing single-color colormaps with the black color as one color component
, such as blue-black, red-black, or yellow-black instead of standard multi-color colormaps (jet, hot, etc.)
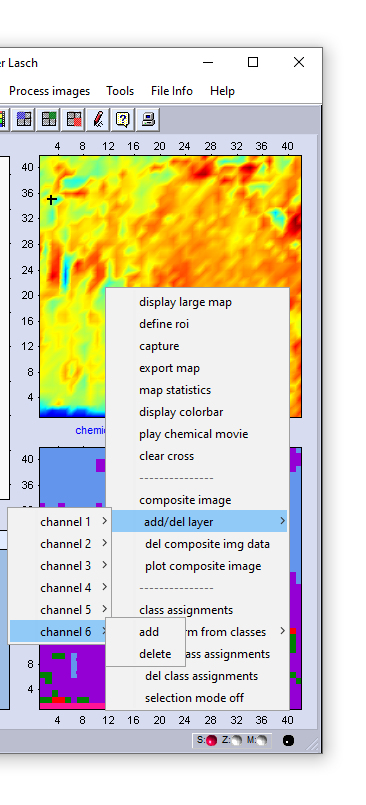
- When finished select the image as the first channel of the composite image. This can be done by choosing composite image
→ channel 1→ add from the context menu of the given image (see screenshot to the right).
- Create the next channel image according to the instructions given by bullet 2. Select this image as channel image #2.
- The procedure described above can be used to define up to six different channel images.
- When all components of the composite image are defined, select plot composite image from the context menu
(see right). This will open a window displaying the composite image. Some of the parameters used to create the individual
channel images will be provided in the report window of CytoSpec. The
composite image can be stored in a bitmap image format (*.bmp). Note that the function export map from the tools
menu of the composite image does not allow exporting z-data of the image.
Channel image #1
colormap red-black
Channel image #2
colormap green-black
Composite image created from channel images #1 and #2
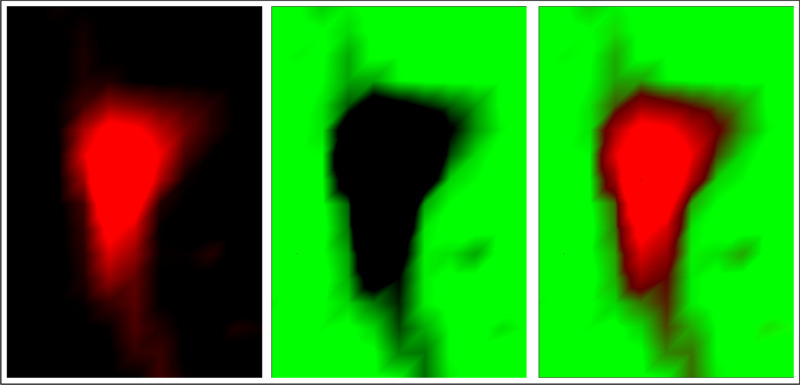
Example of a composite image created from two channel images (data: cell.cyt from the binary test data set provided
with CytoSpec's standard installation package)
How to create composite images from pseudo-color uni- or multivariate displays?
|
|
|
Channel image #1 colormap red-black |
Channel image #2 colormap green-black |
Composite image created from channel images #1 and #2 |
|
|
||
Create Composite Image by Multivariate Imaging Methods
Composite images can be regarded overlays of individual pseudo-color displays. The function 'create composite image by multivariate
imaging methods' is available as an option of imaging functions listed below and allows producing multicolor displays from
individual images constructed from individual cluster membership values (
FCM imaging), endmember projections ( VCA imaging and
nfindr imaging),
distance values ( imaging with with distance values), or from concentration
components obtained by MCR-ALS imaging.
Compositing (Wikipedia)
CytoSpec versions 2.00.07 and later offer composite images to be produced also by multivariate imaging functions, such as:
To learn more about constructing composite images from univariate and multivariate image context menus please refer to
this help section.
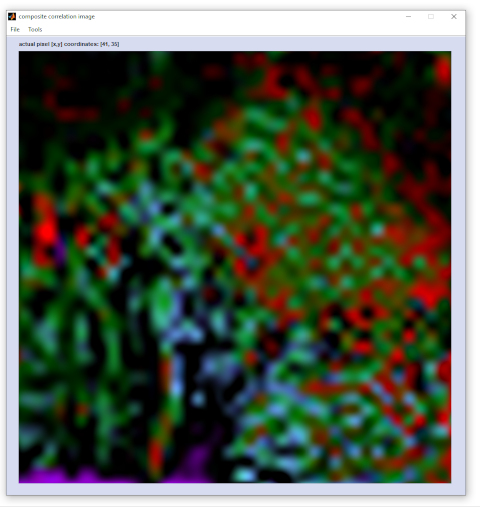
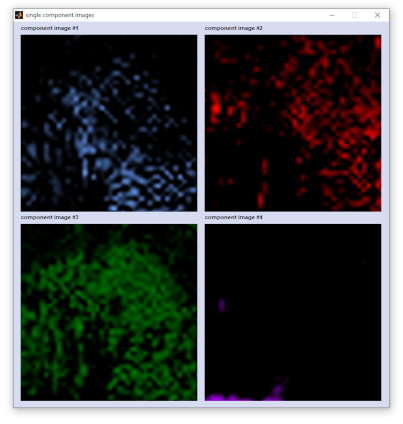
Screenshot of a composite image and the corresponding single component image
|
|
How to create composite images by multivariate imaging functions?
Start one of the multivariate imaging functions listed above. Adjust image generation settings and enter all required parameters. Then press button 'image' (or similar). This will initiate image calculation. When these calculations are finished, the button 'composite image' becomes activated. Press this button - as a result the composite image will be automatically generated and displayed in a new interactive dialog box entitled 'composite xxxx image'. The figure offers a number of options to modify composite images. These program options are explained next.
|
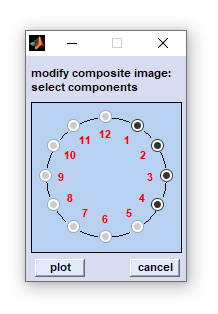
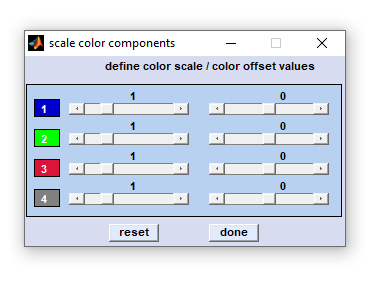
exit: select 'File' → 'exit' from the menu bar of the figure entitled 'composite image' to close the figure. capture to bitmap: (Menu bar 'Tools') allows storing the composite image in the *.bmp image file format. export map: stores image data in the Matlab data format (variable 'data', an array of double precision floating point numbers of size [xdi, ydi, ncomp] with xdi and ydi denoting the number of spectra in x- and y-position, respectively. ncomp denotes the number of components). plot single components: plots a new figure containing ncomp panels of all components that compose the composite image (see screenshot above, right side for an example). exclude components: opens the dialog box 'exclude components' allowing exclusion of individual components (see screenshot to the left). To exclude components just activate, or deactivate the respective radio buttons and press 'plot'. scale intensities: opens another dialog box entitled 'scale color components'. This box displays uicontrols (sliders) that permit adapting color intensities of the individual color components in the composite image (see screenshot to the left). Sliders in the left column of the dialog box can be used to increase, or decrease the color contrast of the respective component plot. Sliders of the right column are helpful to modify color offset values. Actual slider settings are shown above each slider. Press 'reset' to revert to default color scale settings or 'done' when finished. |
[
GENERAL |
FILE |
SPECTRAL PREPROCESSING |
SPATIAL PREPROCESSING |
UNIVARIATE IMAGING |
MULTIVARIATE IMAGING |
TOOLS |
FILE INFO |
GLOSSARY |
CONTACT: info@cytospec.com |
PUBLISHER DETAILS |
PRIVACY POLICY ]
Copyright (c) 2000-2026 CytoSpec. All rights reserved.
FILE INFO |
Copyright (c) 2000-2026 CytoSpec. All rights reserved.