CytoSpec - an APPLICATION FOR HYPERSPECTRAL IMAGING |
||||


|
||||
|
|
|
|||
|
|
||||
Menu Bar 'Spatial Preprocessing' |
||||
|
||||
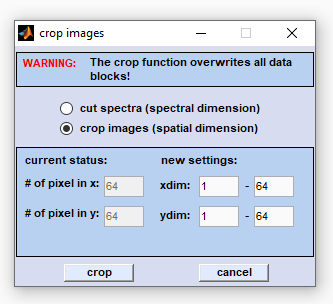
Crop Images |
||||
|
||||

 Load
Load 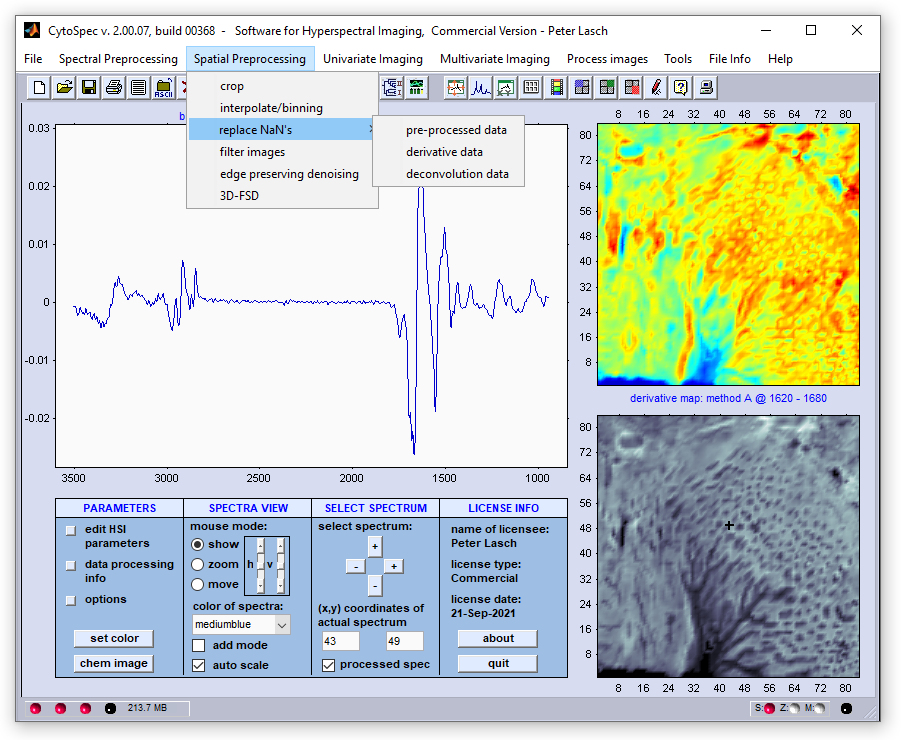
|
Cropping in the spatial (x,y) dimensions reduces the number of pixel spectra. Select the 'crop images' radiobutton and enter the respective values for the x- and y-spatial regions (in pixels) which should be retained. Then press 'crop' to proceed. |
|
Note that the 'cut/crop' function overwrites all existing data blocks (see also
The parameter used for 'cut' are stored within the program workspace and are accessible through the |
|

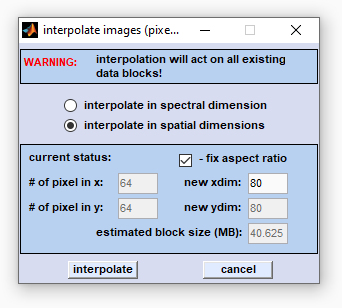
Interpolate in the Spatial Domain - Pixel Binning
CytoSpec's 'interpolation' routines offer two different methods for data interpolation:
- interpolation in the
 spectral domain, and
- interpolation in the spatial domains.
This section describes the interpolate images function which interpolates hyperspectral images (HSI) in the spatial dimensions.
|
Interpolation in the spatial [x,y] dimensions changes the number of pixel spectra. The number of pixel spectra can be increased, or decreased (binning). For example, if the actual number of pixel spectra is 64 × 64 (cf. edit field '# of pixel in x/y') and the settings for 'new xdim/ydim' are 32 × 32, the program performs a two-dimensional interpolation in the spatial domains which will reduce the map size by a factor of 2 × 2. Note that spatial HSI dimensions can be changed to any sizes, e.g. spatial interpolation from an initial HSI size of 64 × 64 to a size of 30 × 32 will be possible. Note also that enlarged images may require a lot of memory resources (RAM) Select the 'interpolate in the spatial dimensions' radiobutton and enter the desired image size in x-direction. Then press 'enter' - the value in the field 'new ydim' will be automatically updated. To change the aspect ratio between the x- and y-dimensions uncheck the checkbox 'fix aspect ratio'. Then press 'interpolate' to proceed. |
|
The 'interpolate / pixel binning' function overwrites all existing data blocks (see also
The parameter used for interpolate are stored within the program workspace and are accessible through |
|
Replace NaN's - Replacing Pixel Spectra by Average Spectra of their Neighbors
CytoSpec's function 'replace NaNs' (NaN - not a number): This function has been introduced with CytoSpec version 2.00.05. The function
is useful to replace pixel spectra containing NaN data by means of average data obtained from neighboring [x,y] pixel spectra.
What are NaN spectra?
NaN spectra, also called 'bad pixel spectra', are produced by the
quality test routine: If the quality test of a given spectrum is negative, the respective spectrum in the data block of preprocessed data
is replaced by NaN (Not a Number) values.
In which cases the function 'replace NaN's will be useful?
Some imaging functions, such as edge preserving denoising, or
3D Fourier-self deconvolution do not accept NaN values as inputs. In
such cases the 'replace NaN' function will be useful for spatial preprocessing hyperspectral data sets.
Algorithm:
- The [x,y] coordinates of all NaN pixel spectra are identified. CytoSpec returns a warning message in cases where more than 15% of
the pixel spectra are NaN spectra.
- CytoSpec determines whether the NaN spectra are located (i) at the the corners of the image, (ii) at the margins of the image,
or (iii) in the center of the image.
- The coordinates of the pixel neighbors are obtained and the number of non-NaN neighbors is determined.
- Mean spectra are obtained from non-NaN neighbors if the number of non-NaN neighbor spectra is larger than zero (corner case i),
one (edge case, ii), or two (center case, iii).
- Mean spectra are used to replace the NaN spectra.
- The algorithm is repeated until all NaN spectra are replaced by non-NaN mean spectra.
Recommendations and Constraints
- This function should only be used to preprocess data prior to edge preserving denoising, 3D Fourier-self deconvolution, or spatial
filtering.
- The function 'replace NaN' should ideally only be employed in cases were single NaN spectra prevent application of the above
mentioned functions.
- Try to avoid replacing NaN spectra from large image regions.
- Do not interpret spectra from regions with interpolated data.
- Replacing NaN spectra is not possible in cases where more than one third (34%) of pixel spectra are NaN spectra.
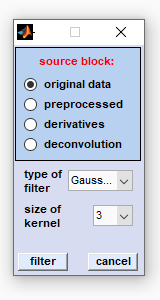
Filter Images
The function 'filter images' can be used to apply frequency filters in the [x,y] image domain. Frequency filters such as low or high pass
(smoothing/sharpening) filters are applied in the image domain to smooth, or sharpen chemical images. The target data block of filtering in the
image domain will be the data block of (de)convolution spectra if the function is applied to original, or pre-processed spectra. If derivative
data are filtered, the target data block will be the block of derivative spectra (see also
Internal Data Organization, Table IX).
|
Select the source data block by clicking the appropriate radio button, then select the spatial filter function and the size of the kernel. To finally apply the spatial filter function click on the 'filter' button. Available filters:
Kernel size: indicates the size of the kernel filter function in pixels |
Edge Preserving Denoising (EPD)
Edge preserving denoising (EPD): This function has been introduced with CytoSpec version 2.00.04 from July 2017. CytoSpec's EPD
implementation can be used to individually perform edge-preserving denoising of each image plane present in a HSI according to an algorithm
proposed by Antonin Chambolle (see below for a reference).
EPD by the Chambolle algorithm can be considered a flavor of total
variation (TV) denoising, also known as total variation regularization. TV denoising is a popular means for noise removal and is based on the
principle that signals with excessive and possibly spurious detail have high total variation, which means that the integral of the signal's
absolute gradient is high. According to this principle, reducing the total variation of the signal, removes unwanted details (noise) whilst
preserving important details such as edges. The concept was pioneered by Rudin, Osher, and Fatemi and is today known as the ROF model (adapted
from Wikipedia, Total variation denoising).
TV-minimizing image restoration can remove noise while preserving larger-scaled image features. Therefore, TV image restoration is especially
effective in restoring images with larger-scaled features. Furthermore, this noise removal technique has advantages over simplier denoising #
techniques such as smoothing images by various low pass filters (see filter
images) which reduce noise but may smooth away at the same edges to a greater or lesser degree. By contrast, TV denoising can be remarkably
effective at simultaneously preserving edges whilst smoothing away noise in flat regions, even at low signal-to-noise ratios. (adapted
from Wikipedia, Total variation denoising)
|
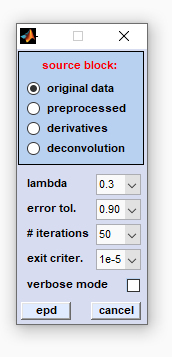
source block: allows selecting the type of source data (original, preprocessed, derivative or deconvolution data). lambda: initial value of the regularization parameter λ defining the strength of smoothing. When λ = 0 there will be no smoothing. As λ → ∞ however, the output data is forced to have smaller total variation (TV) which means that the output is less like the input data. In this way noise (but also parts of the signal) are removed. The choice of the regularization parameter λ thus defines the amount of noise removal. Note that the parameter λ represents in fact λ(0) - an initialization parameter which will be adapted at each iteration step. error tol. (error tolerance): the central parameter of the iterative procedure. The error tolerance value and the noise in the image data are employed to adapt the parameter λ at each iteration cycle. The higher the value of the error tolerance, the shorter the runtime of the routine and the lower the power of edge-preserving denoising. # iterations (number of iterations, n): EPD uses a fast iterative procedure to minimize the total variation of the image plane data. This popupmenu allows defining the maximum number of allowed iterations which might be useful to reduce computational efforts in case of large HSI data sets. Note that the iterative procedure of EPD is executed for each individual image of the HSI. Large values of n may thus result in long EPD computation times. |
|
exit criter. the exit criterion defines the conditions for exiting the iterative cycle and serves as a threshold of the 'change' observed between two consecutive iterations, whereby 'change' is determined on the basis of the following expression: verbose mode: provides additional details of the EPD procedure in CytoSpec's |
|
References to the literature:
(An example of EPD based on Raman microspectroscopy data; note that an alternative EPD method has been used)
3D Fourier Self-Deconvolution (3D-FSD)
Basics of 3D Fourier self-deconvolution and references to the literature:
The method of 3D Fourier self-deconvolution can be considered a technique of
blind deconvolution,
where the transfer function is unknown and a number of assumptions are made for recovering the target scene. The spatial preprocessing function
3D FSD allows simultaneous Fourier self-deconvolution in the two spatial dimensions [x,y] and the spectral/frequency dimensions [λ]. The
method can be applied to enhance the spectral and the spatial resolution in HSI data sets, i.e. to reduce the spectral bandwidths and to increase
the image contrast. 3D-FSD has been adapted from the 1-dimensional method of FSD described in a series of publications:
J.K. Kauppinen, D.J. Moffat, H.H. Mantsch, D.G. Cameron, Fourier Self-Deconvolution: a method for resolving
intrinsically overlapped bands. Appl Spectrosc. 35(3) 1981. 271-276.
J.K. Kauppinen, D.J. Moffat, H.H. Mantsch, D.G.
Cameron, Self-deconvolution and first order derivatives using Fourier transforms. Anal Chem. 53(9) 1981. 1454-1457.
J.K. Kauppinen, D.J. Moffat, H.H. Mantsch, D.G. Cameron,
Noise in Fourier self-deconvolution. Appl. Opt. 20(3) 1981. 1866-.
Procedure of 3D-FSD:
- Exponential functions of the form f(i) = exp(2 × π × γ × |i|) are defined in the x-,y-
(spatial) and λ- (spectral) dimensions.
- These exponential functions f(x), f(y) and f(λ) are in the following multiplied to form a 3D exponential
function E(x,y,λ)
- A 3D damping function is generated in the same way: Damping functions are defined for the x-,y- and λ-dimensions according to
D(i) = [1-(|i|/k(i))]², for |i| ≤ k(i) and D(i) = 0 for |i| > k(i).
The 3D-damping D(x,y,λ) function is produced by multiplication of D(x), D(y) and D(λ).
- The deconvolution function F(x,y,λ) is obtained as the product of the 3D exponential E(x,y,λ) and 3D damping
D(x,y,λ) function
- The 3D HSI data cube C(x,y,λ) is Fourier transformed.
- The Fourier transformed data is multiplied by the deconvolution function F(x,y,λ)
- Finally, the product is inversely Fourier transformed to get the resolution-enhanced (deconvoluted) HSI data.
Constraints:
k-factors must be larger than zero and smaller than one: the larger k(i), the more smoothing is applied to the data in dimension
i. CytoSpec allows individual settings of k-factors for each of the dimensions. In practice however, it is recommended to apply
identical values for k in the two spatial dimensions i.e. k(x) should equal k(y) if both dimensions are commutable.
Gamma-factors (γ>0) determine the power of deconvolution: The higher γ(i), the higher the power of deconvolution in the
respective dimension.
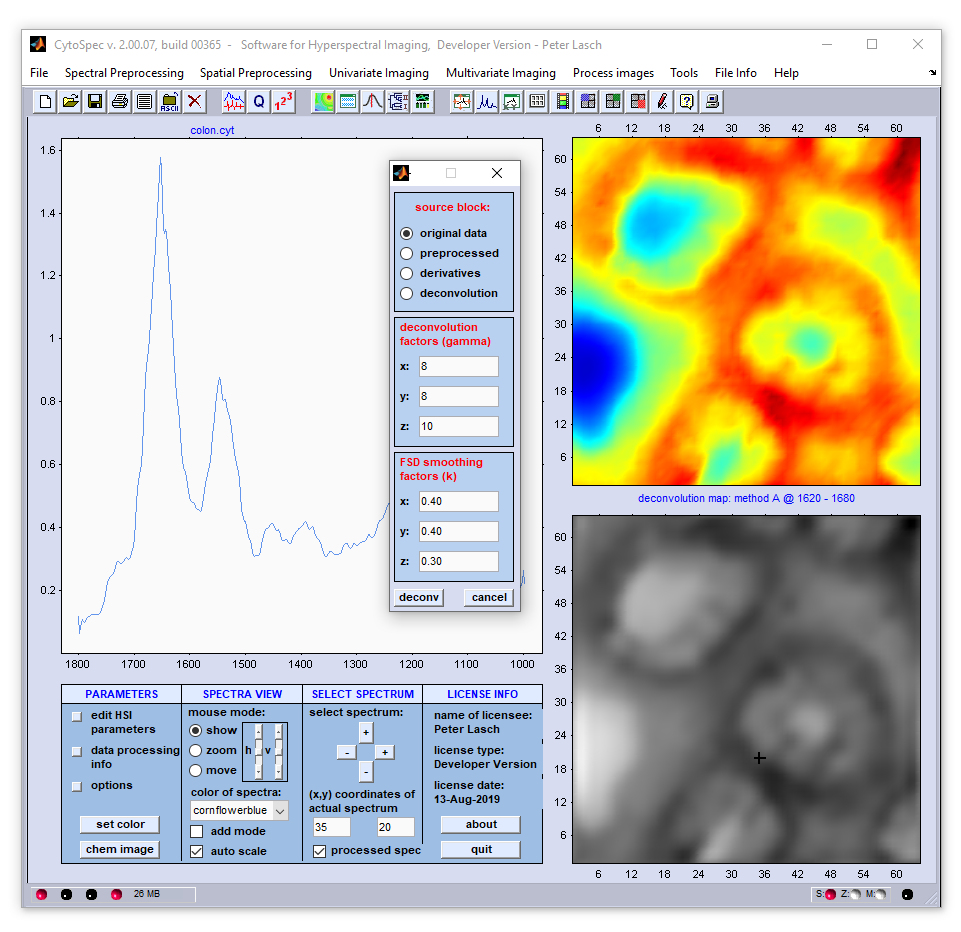
Screenshot of the dialog box '3D-Fourier self-deconvolution' (3D-FSD)
Example: The example below shows the results of 3D-FSD where data were acquired by the use of a 64 × 64 mid-infrared MCT focal plane
array detector. For chemical imaging, the absorbance values at 1731 wavenumbers of the original spectral (upper image) and of the deconvolution data
block (lower panel) were color encoded and plotted as a function of the [x,y] positions. The panel to the left displays the original (blue) spectra
and 3D-FSD spectra (red).
Important :
3D Fourier self-deconvolution is only applicable to spatial and spectral envelopes much broader than the spatial/spectral resolution. Avoid oscillatory
patterns (side lobes) due to over-deconvolution! In such cases either increase the smoothing factors k(i)
and/or reduce the deconvolution factor(s) γ(i).
References to the literature:
Lasch P. Naumann D. Spatial Resolution in Infrared
Microspectroscopic Imaging of Tissues. Biochim Biophys Acta (BBA) - Biomembranes 2006 1758(7):814-29.
[
GENERAL |
FILE |
SPECTRAL PREPROCESSING |
SPATIAL PREPROCESSING |
UNIVARIATE IMAGING |
MULTIVARIATE IMAGING |
TOOLS |
FILE INFO |
GLOSSARY |
CONTACT: info@cytospec.com |
PUBLISHER DETAILS |
PRIVACY POLICY ]
Copyright (c) 2000-2026 CytoSpec. All rights reserved.
FILE INFO |
Copyright (c) 2000-2026 CytoSpec. All rights reserved.