CytoSpec - an APPLICATION FOR HYPERSPECTRAL IMAGING |
|||


|
|||
|
|
|
||
|
|
|||
Menu Bar 'Univariate Imaging' |
|||
|
|||
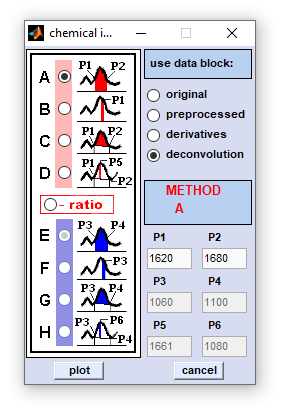
Chemical Imaging |
|||
Method B: obtains a simple absorbance, or spectral intensity value at a given wavenumber, or frequency position P1 Method C: calculates the area formed by the linear conjunction line of points P1 and P2 and the spectral curve in the region between both points. Method D: obtains a baseline corrected absorbance, or spectral intensity value at a given at a given wavenumber, or frequency position P5. The baseline is formed by the linear conjunction line of points P1 and P2 Methods A-D/E-H: calculate ratios between absorbance, or spectral intensity values obtained by methods A-D and E-H, respectively. |
|||

 Load
Load 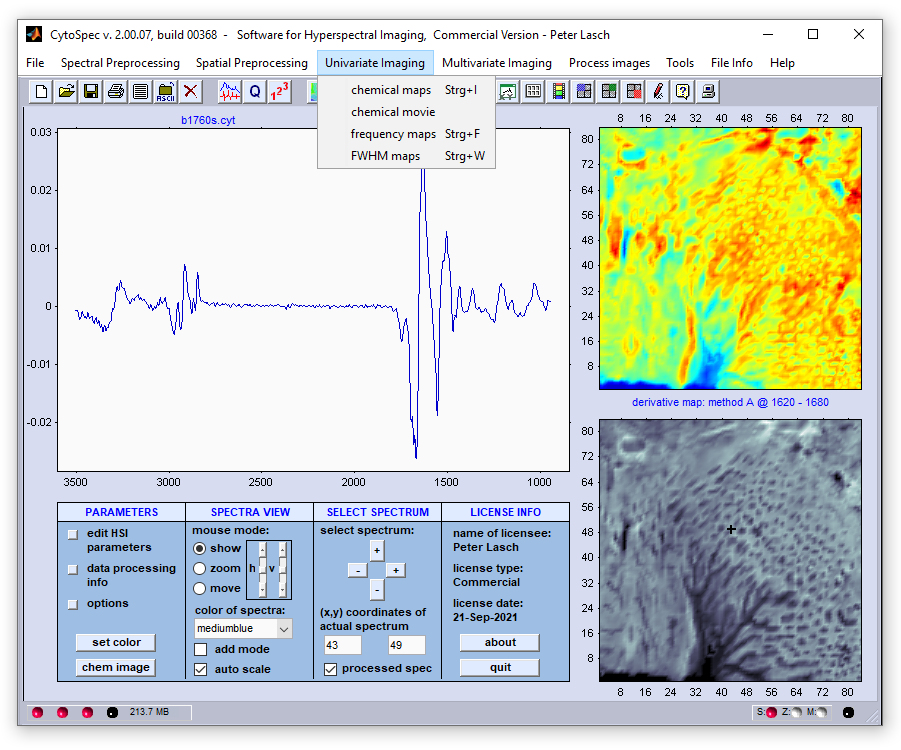
|
|
Mouse clicks by the left mouse button into chemical images result in the following actions (if 'show mode' is active):
- the [x,y] coordinate of the mouse pointer is obtained and displayed in the editable text boxes of the main figure,
- the corresponding spectrum is extracted from the hyperspectral map and is plotted in the spectra panel located at the left, and
- information of how the chemical image was produced is displayed in the area between image panels to the right. Please
refer to the section
 Main Window - Basics Concepts for more details.
Related Topics

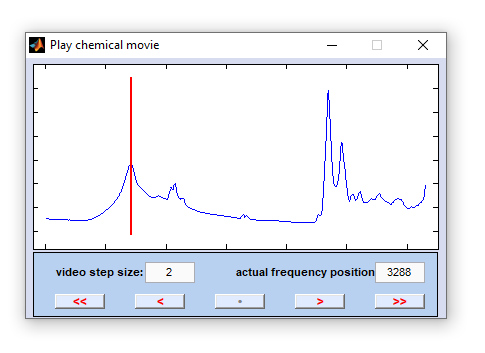
Chemical Movie
The function 'chemical movie' can be used to play an animation of chemical images, or frequency slices. With this function the
system automatically steps through a range of frequency values, facilitating judgment of the spatial distribution patterns of individual
spectral modes. Chemical images are generated by using option 'B' of the function
chemical imaging.
|
< << • > >> |
one step (frequency position) backward starts an animation of the frequency slices (='chemical movie') in backward direction stop playing the chemical movie one frequency slice forward plays the chemical movie in forward direction |
increment: the step size between two consecutive video frames in frequency units, i.e. wavenumber, or Raman shift positions [cm⁻¹]. Values smaller than 1 are permitted. The default value for 'increment' equals 2.
actual position: frequency position of the actual video frame given in frequency units, i.e. wavenumber, or Raman shift positions [cm⁻¹].
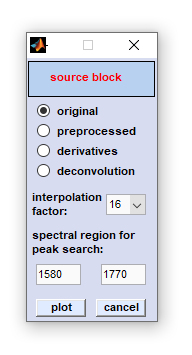
Frequency Imaging
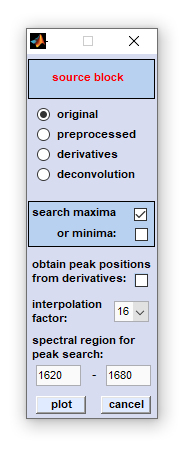
Frequency imaging: This function permits visualization of peak positions, and their variations, within hyperspectral image data.
Band positions - either maxima or minima - are obtained, its values are color-converted and plotted as functions of the spatial coordinates.
Band positions can be obtained from all types of data blocks, including also derivative spectra (for details refer to chapter
Internal Data Organization).
Two different methods of the 'frequency map' routine are available: Peak maxima/minima can be obtained from spectra contained
in one of the four data blocks, or for overlapping bands from second derivative data blocks (this may also be second derivatives from
spectra of the derivative data block!).
The use of second derivatives for peak picking may be useful for the detection of peaks in the presence of strongly overlapping signals,
i.e. when the band is only a small shoulder on a strong signal. To some extent 2nd derivatives compensate also for baseline effects.
Derivatives should be used with care as noise is considerably amplified.
The algorithm of the peak picking routine works as follows:
A. If the option 'obtain peak positions from derivatives' was NOT selected:
1. Spectra of the data block of your choice (see option 'use data block') are interpolated. For interpolation, the
spline method is used. Interpolation is carried out in the frequency range indicated in the edit fields 'select spectral region
for peak search'. Furthermore, a factor of interpolation can be selected. This factor indicates how many times the number of
data points will be increased by interpolation (only in the spectral region selected for peak picking).
2. If the option 'search maxima' was checked, the algorithm is then searching for the x-positions (frequencies) of the
maxima within the spectral region indicated by the user. If minima are chosen, the program is searching for minima. IMPORTANT: If
band positions are obtained from the data block of derivative spectra, maxima appear in second derivative spectra as minima and vice
versa. There is no check for i) the order of the derivative and consequently ii), no compensation for the inversion of maxima and
minima!
3. The frequency values of the maxima/minima are color scaled and plotted as a function of the spatial coordinates. If you
wish to further analyze the band positions by other programs you can access the data matrix of frequency values by using the
Export Maps function.
B. The option 'obtain peak positions from derivatives' was checked:
1. Second derivative spectra from the data block of your choice (see option 'use data block') are calculated
by applying the Savitzky-Golay algorithm with 5 smoothing points (see also chapter
Calculation of Derivative Spectra).
2. Derivative spectra are interpolated. For interpolation, the spline method is used. Interpolation is carried out in the
frequency range indicated in the edit fields 'select spectral region for peak search'. Furthermore, a factor of
interpolation can be selected. This factor indicates how many times the number of data points will be increased upon interpolation
in the spectral region selected for peak picking.
3. If the option 'search maxima' was checked, the algorithm is then searching for the x-positions (frequencies)
of the maxima within the spectral region indicated by the user. If minima are chosen, the program is searching for minima.
IMPORTANT: If band positions are obtained from the data block of derivative spectra, maxima appear in second derivative spectra
as minima and vice versa. There is no check for i) the order of the derivative and consequently ii) no compensation for the
inversion of maxima and minima!
4. The frequency values of the maxima/minima are color scaled and plotted as a function of the spatial coordinates.
If you wish to further analyze the band positions by other programs you can access the data matrix of frequency values by using
the Export Maps function.
2. If the option 'search maxima' was checked, the algorithm is then searching for the x-positions (frequencies) of the maxima within the spectral region indicated by the user. If minima are chosen, the program is searching for minima. IMPORTANT: If band positions are obtained from the data block of derivative spectra, maxima appear in second derivative spectra as minima and vice versa. There is no check for i) the order of the derivative and consequently ii), no compensation for the inversion of maxima and minima!
3. The frequency values of the maxima/minima are color scaled and plotted as a function of the spatial coordinates. If you wish to further analyze the band positions by other programs you can access the data matrix of frequency values by using the
2. Derivative spectra are interpolated. For interpolation, the spline method is used. Interpolation is carried out in the frequency range indicated in the edit fields 'select spectral region for peak search'. Furthermore, a factor of interpolation can be selected. This factor indicates how many times the number of data points will be increased upon interpolation in the spectral region selected for peak picking.
3. If the option 'search maxima' was checked, the algorithm is then searching for the x-positions (frequencies) of the maxima within the spectral region indicated by the user. If minima are chosen, the program is searching for minima. IMPORTANT: If band positions are obtained from the data block of derivative spectra, maxima appear in second derivative spectra as minima and vice versa. There is no check for i) the order of the derivative and consequently ii) no compensation for the inversion of maxima and minima!
4. The frequency values of the maxima/minima are color scaled and plotted as a function of the spatial coordinates. If you wish to further analyze the band positions by other programs you can access the data matrix of frequency values by using the
'Frequency Imaging' |
|
Related Topics
FWHM Imaging
FWHM imaging: This is a function introduced with CytoSpec version 2.00.05 (Feb 2018). The FWHM imaging function is suitable for
creating pseudo-color images based on the full width at half maximum (FWHM) of vibrational bands. The function requires the presence of
a band in a given spectral interval, ideally in all spectra of the hyperspectral image.
|
|
Related Topics
[
GENERAL |
FILE |
SPECTRAL PREPROCESSING |
SPATIAL PREPROCESSING |
UNIVARIATE IMAGING |
MULTIVARIATE IMAGING |
TOOLS |
FILE INFO |
GLOSSARY |
CONTACT: info@cytospec.com |
PUBLISHER DETAILS |
PRIVACY POLICY ]
Copyright (c) 2000-2026 CytoSpec. All rights reserved.
FILE INFO |
Copyright (c) 2000-2026 CytoSpec. All rights reserved.